|
<< Click to Display Table of Contents >> Stats interface features |
Statistics interface offers two data view options:
•Flexible reporting period
•Data grid view
•Timeline data view
Flexible reporting period
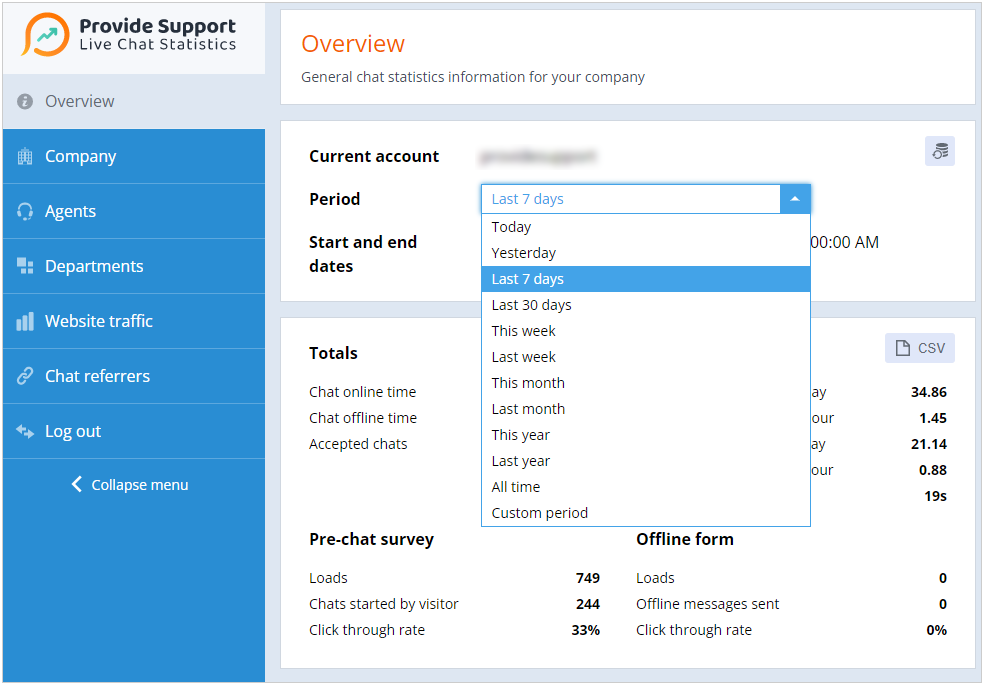
To load the statistical data you need to select the period you would like to load the data for:

Reporting period
Please note!: the statistical data starts collecting after the date the statistics collection was enabled in the account
Data overview
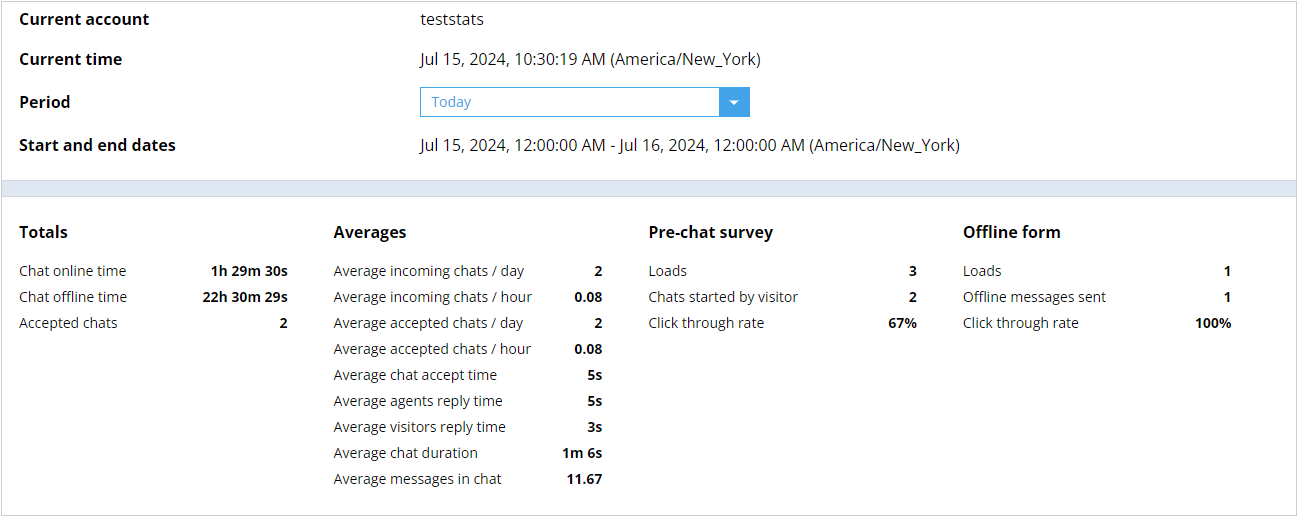
General information overview is available for the whole account, departments and operators. Here is the example of data overview:

Whole account data overview
More detailed view is available in a grid for operators, departments, traffic stats, referrers and chat referrers, here are examples:

Operator data overview example

Grid View
Timeline view
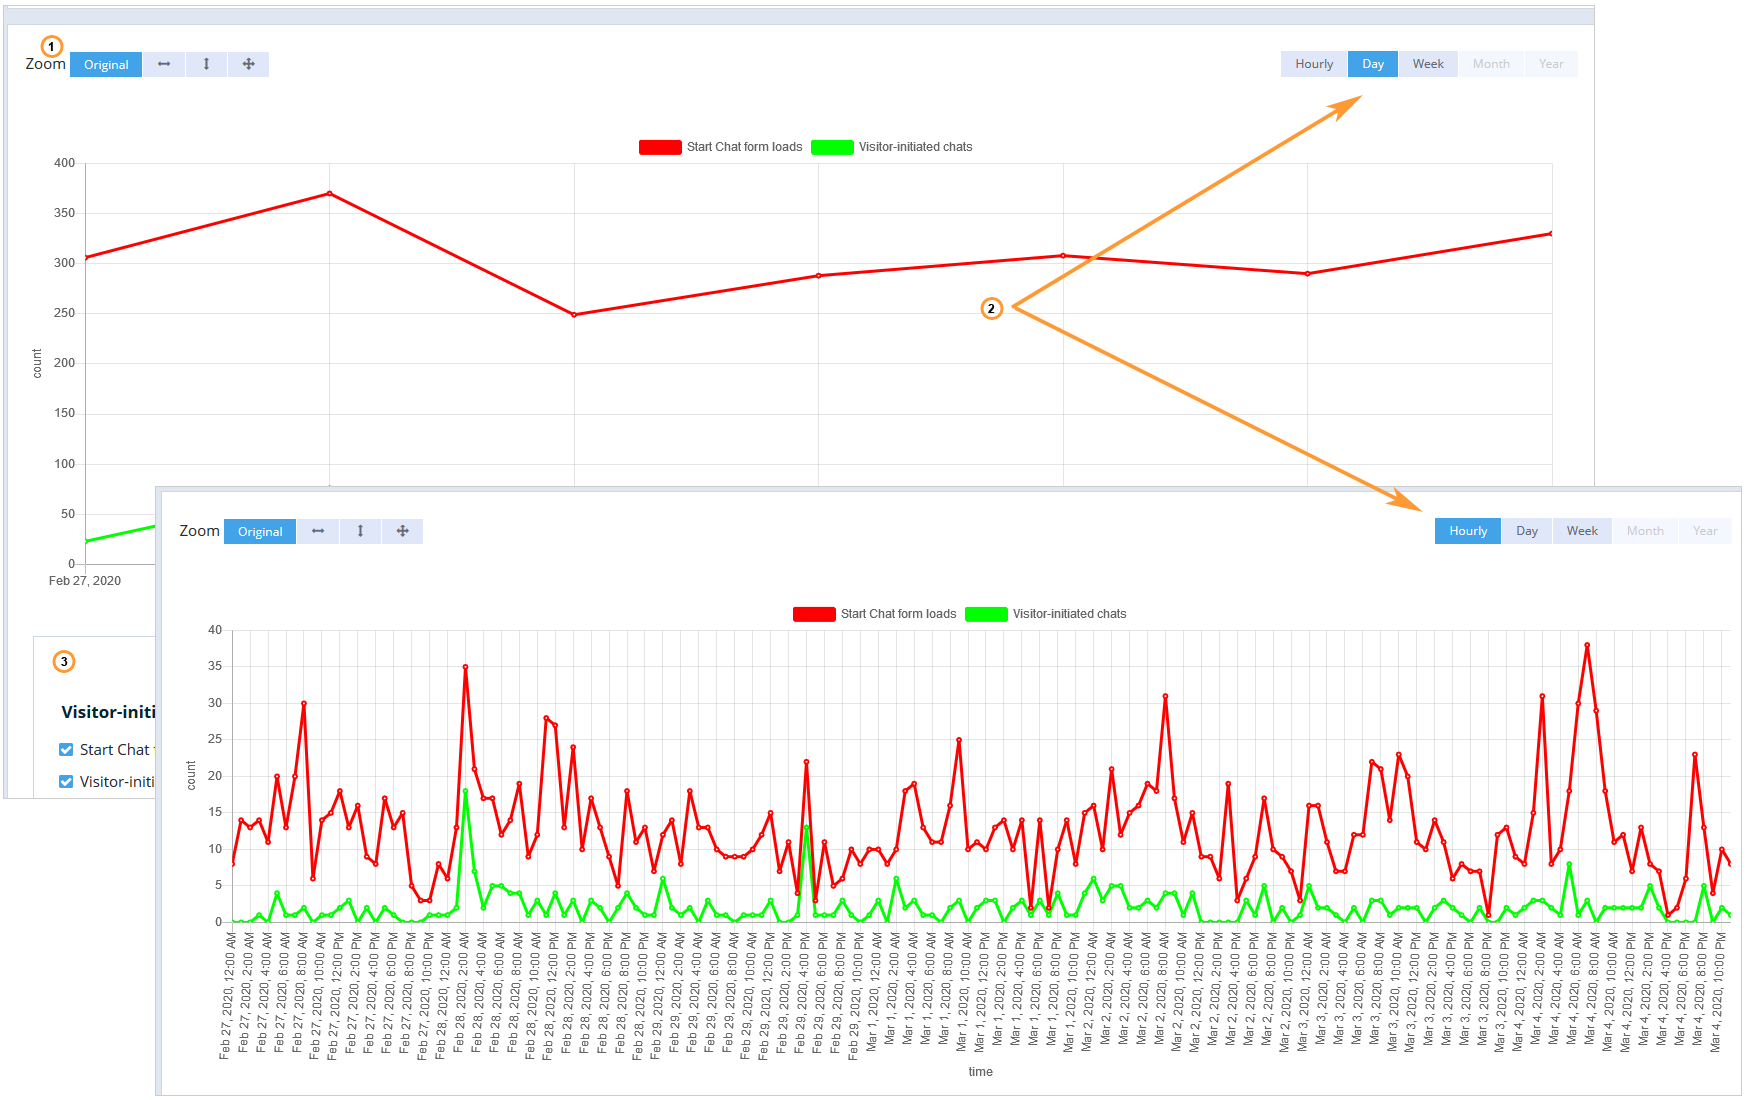
All information presented in the grids can be shown on the timeline by enabling the respective checkbox. The timeline shows more detailed information depending on the selected timeline period.

Timeline view examples
Features supported in the timeline view:
1.Graphics zooming: vertical, horizontal, for both axis
2.Switching timeline detailing
3.Storing timeline view settings
Statistics language
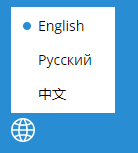
The Provide Support live chat statistics app is available in English, Russian and Chinese. You can choose the interface language bu clicking the globe icn in the bottom left corner of the app:

App language