|
<< Click to Display Table of Contents >> Agents Stats |
Agents reporting overview
The Agent Statistics report tracks agent workload, response times, conversation volume, and customer satisfaction. Managers and team leads can use this data to check team performance, plan staffing needs, and review agent activity.
The Agents tab is organized around two primary routing architectures:
•"To All" Chats Distribution: Every incoming visitor chat is routed simultaneously to all eligible, online operators. The first agent to accept the request handles the visitor.
•Individual Chats Distribution: Incoming chats are routed specifically to a single assigned agent using chats distribution methods: "Random", "Round Robin", or visitor-driven "Preferred Operator" selection.
This structural change affects how the system calculates, totals, and analyzes core metrics like Chat Calls, Missed Chats, Acceptance Rate, and Load Rate.
Agents reporting for the account with "To all" chats distribution

Statistics for operators with "to all" chats distribution enabled in the account
1.Expand / hide table view: Allows users to collapse the graphical visualization to maximize screen for deep tabular data analysis.
2.Operator names and operator logins: Displays the identity of each agent row. Historical statistics rows are preserved when an agent's login or nickname changes.
3.Chat calls - the total number of incoming chats routed to an agent. With "to all" chats distribution method incoming chats are usually routed to multiple agents and each chat is considered as an incoming one for all these agents. That's why "Totals" for chat calls in the table is less than the sum of all agents' incoming chats. In this case, totals for chat calls - is the total number of all chats started by visitor for the selected period of time.
4.The number of accepted chats. Total number of visitor chats successfully accepted by the agent with confirmed simultaneous presence (overlap).
5.Acceptance rate: The percentage of routed chats successfully accepted by the agent (Accepted chats / Chat calls * 100%).
6.Load rate: The proportion of total company incoming chat volume handled by or assigned to the agent..
7.Averages on the agent's performance.
a.Average chat accept time - the total time taken to accept chats divided by the total number of chats.
b.Average agent messages in chat - the total agent's messages in all accepted by an agent chats divided by the number of total agent's chats.
c.Average reply time - the total reply time divided by the total number of messages.
d.Average chat duration - the total duration of all chats divided by the number of chats of an agent.
e.Average total messages in chat - the total number of messages both by visitor and agent divided by the number of agent's chats.
8.Post Chat Survey results: Customer satisfaction ratings from standard surveys: Solved/Not Solved, Contented/Not Contented, Politeness (1–5), and Proficiency (1–5)..
9.Invitations sent, accepted and declined.
10.Statistics on agent calls and invitations:
a.Agents invited to chats - how many times co-workers were invited to chat
b.Received agents' invitations - how many times an agent was invited to chats of other co-workers
c.Calls to agents - the number of initiated operator-to-operator chats
d.Received calls from agents - the number of internal chats initiated by other agents
11. Joined chats. Counts successful room entries initiated by supervisors.
12.Online, Away and Offline time: Total time spent by the operator profile in Online, Away, and Offline states within the report period.
13.Shows or hides columns. Customization menu allowing administrators to toggle visibility of any metric column and drag-and-drop to reorder.
14.Reset cells selection (data displayed on a graphic): Clears highlighted cell selections, restoring the default aggregate chart presentation.
15.Export data to CSV. Generates a downloadable CSV spreadsheet snapshot reflecting active filters, time zones, and exact underlying integer metrics.
16.Totals for agents: Company-wide roll-up row summarizing account-level chat traffic, accepted volume, missed volume, and collective averages.
Please note! There is no sense in Missed chats counter for agents when "To All" chats distribution is used as each chat is routed to multiple agents and when the chat is missed it is missed by the whole team, not the specific agent.
Operators reporting for the account with "Random" or "Round Robin" chats distribution
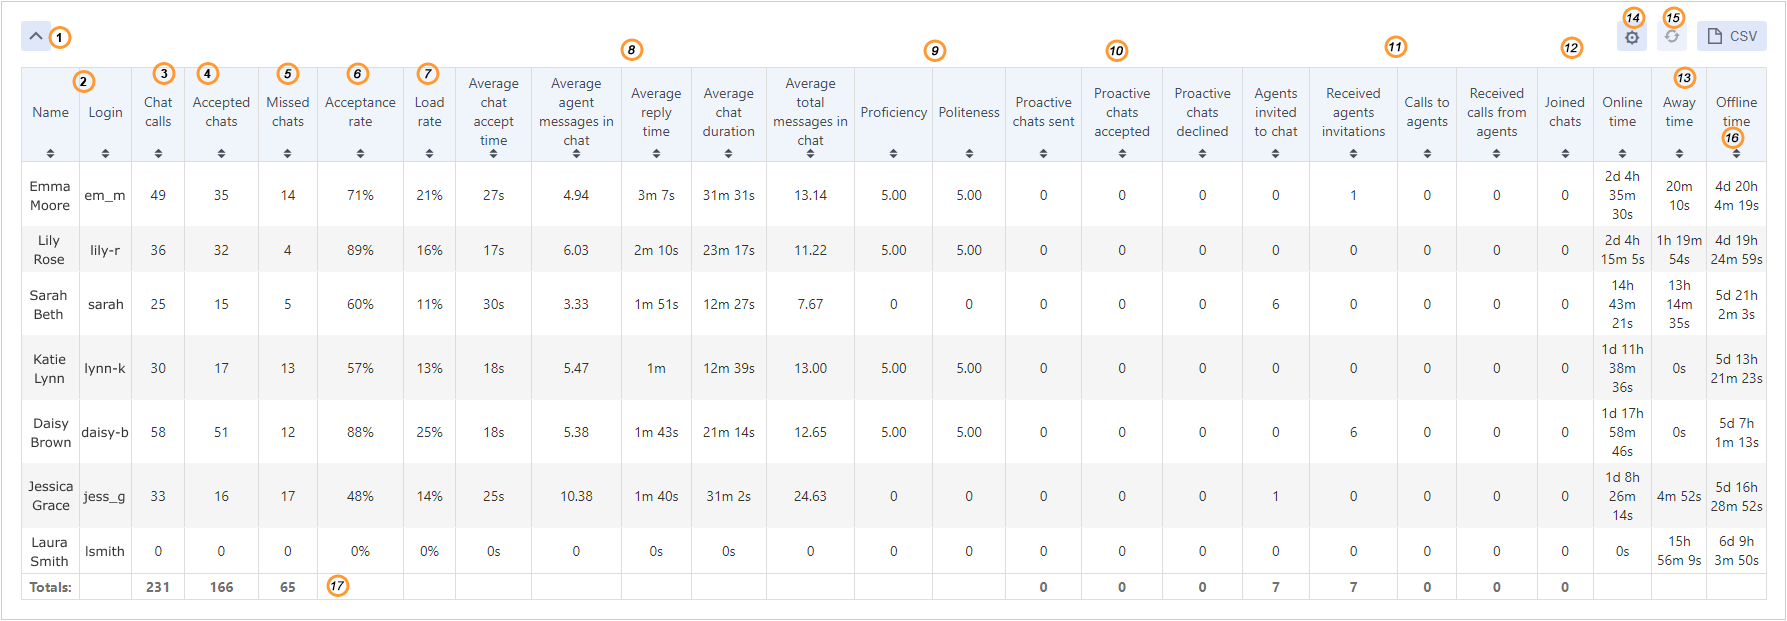
Agents stats for random and round robin chats distribution
1.Expand / hide table view: Allows users to collapse the graphical visualization to maximize screen real estate for deep tabular data analysis
2.Operator names and operator logins: Displays the identity of each agent row. Historical statistics rows are preserved when an agent's login or nickname changes.
3.Chat calls: the total number of incoming chats routed to an agent.
4.The number of accepted chats: Total number of visitor chats successfully accepted by the agent with confirmed simultaneous presence (overlap).
5.Missed chats: Measures chats routed to an assigned agent that ended without acceptance or overlap.
6.Acceptance rate: The percentage of routed chats successfully accepted by the agent (Accepted chats / Chat calls * 100%).
7.Load rate: The proportion of total company incoming chat volume handled by or assigned to the agent.
8.Averages on the agent performance
a.Average chat accept time - the total time taken to accept chats divided by the total number of chats
b.Average agent messages in chat - the total agent's messages in all accepted by an agent chats divided by the number of total agent's chats
c.Average reply time - the total reply time divided by the total number of accepted by an agent chats
d.Average chat duration - the total duration of all chats divided by the number of chats of an agent
e.Average total messages in chat - the total number of messages both by visitor and agent divided by the number of agent's chats
9.Post Chat Survey results: Customer satisfaction ratings from standard surveys: Solved/Not Solved, Contented/Not Contented, Politeness (1–5), and Proficiency (1–5)
10.Statistics on chat invitations
11.Statistics on agent calls and invitations:
a.Agents invited to chats - how many times co-workers were invited to chat
b.Received agents' invitations - how many times an agent was invited to chats of other co-workers
c.Calls to agents - the number of initiated operator-to-operator chats
d.Received calls from agents - the number of internal chats initiated by other agents
12..Joined chats. Counts successful room entries initiated by supervisors
13.Online, Away and Offline time of an agent. Total time spent by the operator profile in Online, Away, and Offline states within the report period.
14.Shows or hides columns. Customization menu allowing administrators to toggle visibility of any metric column and drag-and-drop to reorder.
15.Reset cells selection (data displayed on a graphic): Clears highlighted cell selections, restoring the default aggregate chart presentation.
16.Export data to CSV: Generates a downloadable CSV spreadsheet snapshot reflecting active filters, time zones, and exact underlying integer metrics.
17.Totals for statistical data on all agents. Company-wide roll-up row summarizing account-level chat traffic, accepted volume, missed volume, and collective averages.
Statistics columns managing
•Columns can be reordered by drag and drop
•Columns can be shown or hidden. You can check or uncheck the boxes in front of the column names to hide them or show in the statistics table:
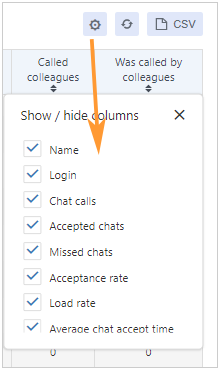
Hide and add columns
Best practices
Supervisors can use Agents Statistics to drive measurable improvements in team performance, responsiveness, and customer satisfaction:
•Addressing low acceptance rates: In "To All" routing, a low Acceptance Rate (under 10%) usually means an agent hesitates or waits for teammates to take chats. On the other hand, a very high Acceptance Rate combined with slow reply times often points to an agent taking on more chats than they can manage.
•Balancing workload distribution: In Individual routing, examine Load Rate across agents to ensure fair distribution. If certain agents show disproportionately high load rates, verify that department routing rules and agent schedule shifts are balanced.
•Correlating speed with satisfaction: Track the connection between Average Reply Time and Customer Satisfaction (Proficiency and Politeness). Keeping reply times under 20 seconds typically yields 4.8+ ratings and higher case resolution rates.
•Evaluating supervisory mentorship: Review Joined Chats and Received Invitations to identify senior staff who actively mentor junior agents during complex technical inquiries. This data highlights collaborative contributions that traditional chat volume metrics might miss.