|
<< Click to Display Table of Contents >> Departments Stats |
Departments reporting overview
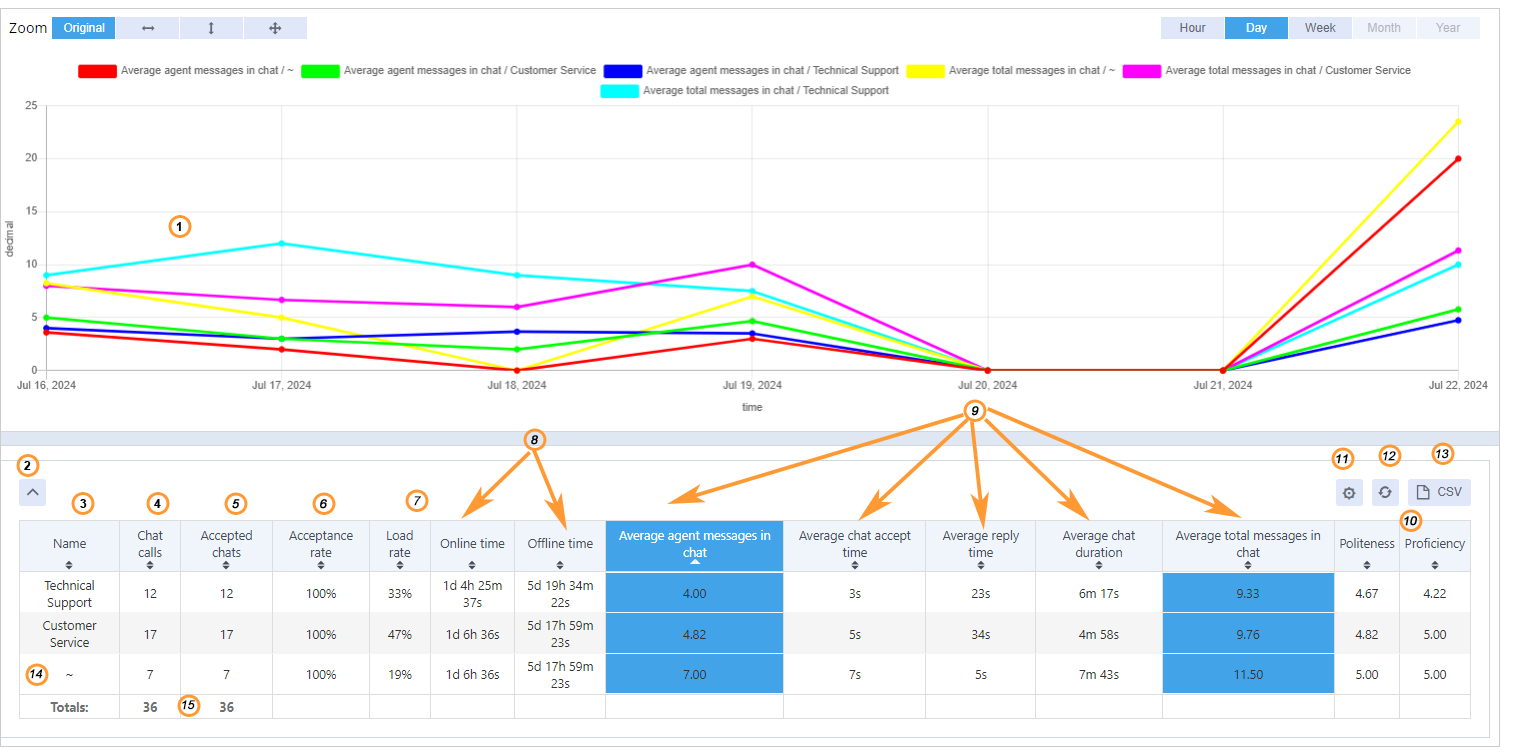
The statistics is shown for chats routed to specific departments. If departments selection is not enabled in the account, all chats which were not assigned to any department will be listed next to the tilde sign ~ in the grid.

Departments reporting
1.Graphical representation for department statistics
2.Expand / hide grid view
3.Department name
4.Chat calls: the number of chats per department
5.Accepted chats: the number of chats accepted by agents assigned to a department
6.Acceptance rate: the ratio of accepted chats and total chats assigned to agents within a department: Accepted chats * 100% / Chat calls
7.Load rate: the ratio of accepted chats per department and all accepted chats within all departments
8.Online time, Offline time: the time department remained online and offline
9.Averages:
a.Average agent messages in chat: the total number of agents' messages in all accepted chats within the department divided by the number of chats handled within the department
b.Average chat accept time: the ratio of total time taken to accept chats to the total number of chats handled within a department
c.Average reply time: the total reply time divided by the total number of accepted within a department chats
d.Average chat duration: the total time of department chats divided by the number of chats
e.Average total messages in chat: the total number of agents' and visitors' messages in all department chats divided by the number of chats handled within the department
10.Post chat survey reporting: by default "Politeness" and "Proficiency" fields are displayed.
11.Shows or hides columns
12.Reset cells selection (data displayed on a graphic)
13.Export data to CSV
14.Chats that were not assigned to any department
15.Totals of all chats, accepted chats and missed chats
For Random, Round Robin, Random load balanced and Round robin load balanced chat distribution methods an additional metric "Missed chats" which indicates the number of missed chats by all agents assigned to a department is displayed.
Advantages
If you have departments in your account, you can see which department your customers contact more and as a result empower it with additional employees